· The gender gap is considerably smaller than the inequalities of attainment associated with ethnic origin and social class background,
· ethnic inequalities persist even when simultaneously controlling for gender and class,
· when comparing like with like, in terms of gender, class and ethnic origin, consistent and significant ethnic inequalities of attainment remain clear.
His analysis of research showed that the biggest factor impacting on outcomes was class but this was closely followed by race and then finally gender.
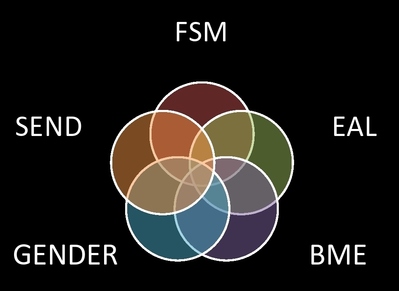
More recently, educational discourse has tended to focus solely on social class at the expense of other factors. Whilst there is no denying that social class is a primary driver of inequality, what is rarely discussed is the impact of social class on ‘different groups of pupils’, using Ofsted terminology. DfE data over a period of time, clearly shows that most minority ethnic groups of pupils with the exception of Indian and Chinese heritage pupils, have higher rates of free school meal eligibility compared to the average for all pupils, as do pupils with English as an additional language and those with Special Educational Needs and Disabilities, yet the ‘intersectionality’ of needs and how it operates is rarely, if ever discussed. One of the reasons for this lack of discussion is that this information is not easily accessible nor it in the public domain, despite the significant increase in the amount of data that is available to hold schools to account.
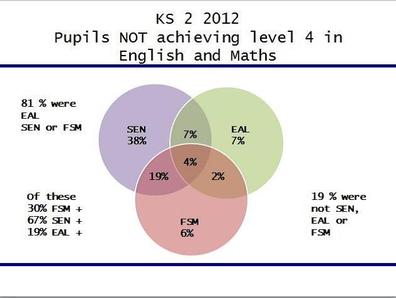
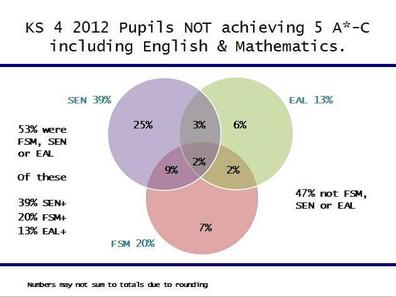
Recently, I was able to obtain some information from the DfE to illustrates how intersectionality operates. The Venn Diagrams in the charts below are based on information shared in March 2013 at a DfE Roundtable meeting, looking at which pupils did not attain to national expectations at both KS2 and KS4. They shed some light on how intersectionality operates. Unfortunately, this data only focuses on the three factors of FSM eligibility, EAL & SEN and do not show how ethnicity and gender interplay.
Key Stage 2 Level 4 + in English & Maths
Although, we know many BME communities have much higher rates of FSM eligibility than the average, and will therefore be included in the FSM category, what is not as well-known is the fact that many non – FSM BME groups are also more likely to be less well – off than the average non –FSM pupil, so the crude use of FSM and non-FSM could be detrimentally affecting more less well-off BME pupils than the average. It is also worth sharing the following two stark facts, again sourced from the DfE Closing the Gap Roundtable meeting in March 2013 for KS 2:
- Although rates of low attainment are higher among FSM pupils, only a minority of FSM pupils are low attaining (26%) and only a minority of low attaining pupils are eligible for FSM (23%)
- 18% were eligible for free school meals, 21% didn’t achieve at least level 4 in both English and maths
illustrating the complex reasons for under attainment that presently exist, which are well beyond the current simplistic discourse that is prevalent within education presently.
I hope these facts are used to stimulate professional conversations within schools and regions, as to which pupils are still under-attaining and where possible encourage them look across more than one characteristic at a time, so that effective and relevant strategies are used to close the gaps and that these are tailored more specifically to the needs of pupils.


 RSS Feed
